
Eventsquid provides a comprehensive reporting suite, with a series of standard reports along with a custom report builder. While "standard reports" can be rigid, Eventsquid allows you to build custom versions off of standard reports to better meet your event reporting needs.
These reports can be shared across your organization dashboard and sent to external parties for better collaboration.
TABLE OF CONTENTS
See below the list of reports available within the Eventsquid Standard Reporting suite. Click a report to learn more about it:
STANDARD REPORTING - HOW EACH REPORT WORKS
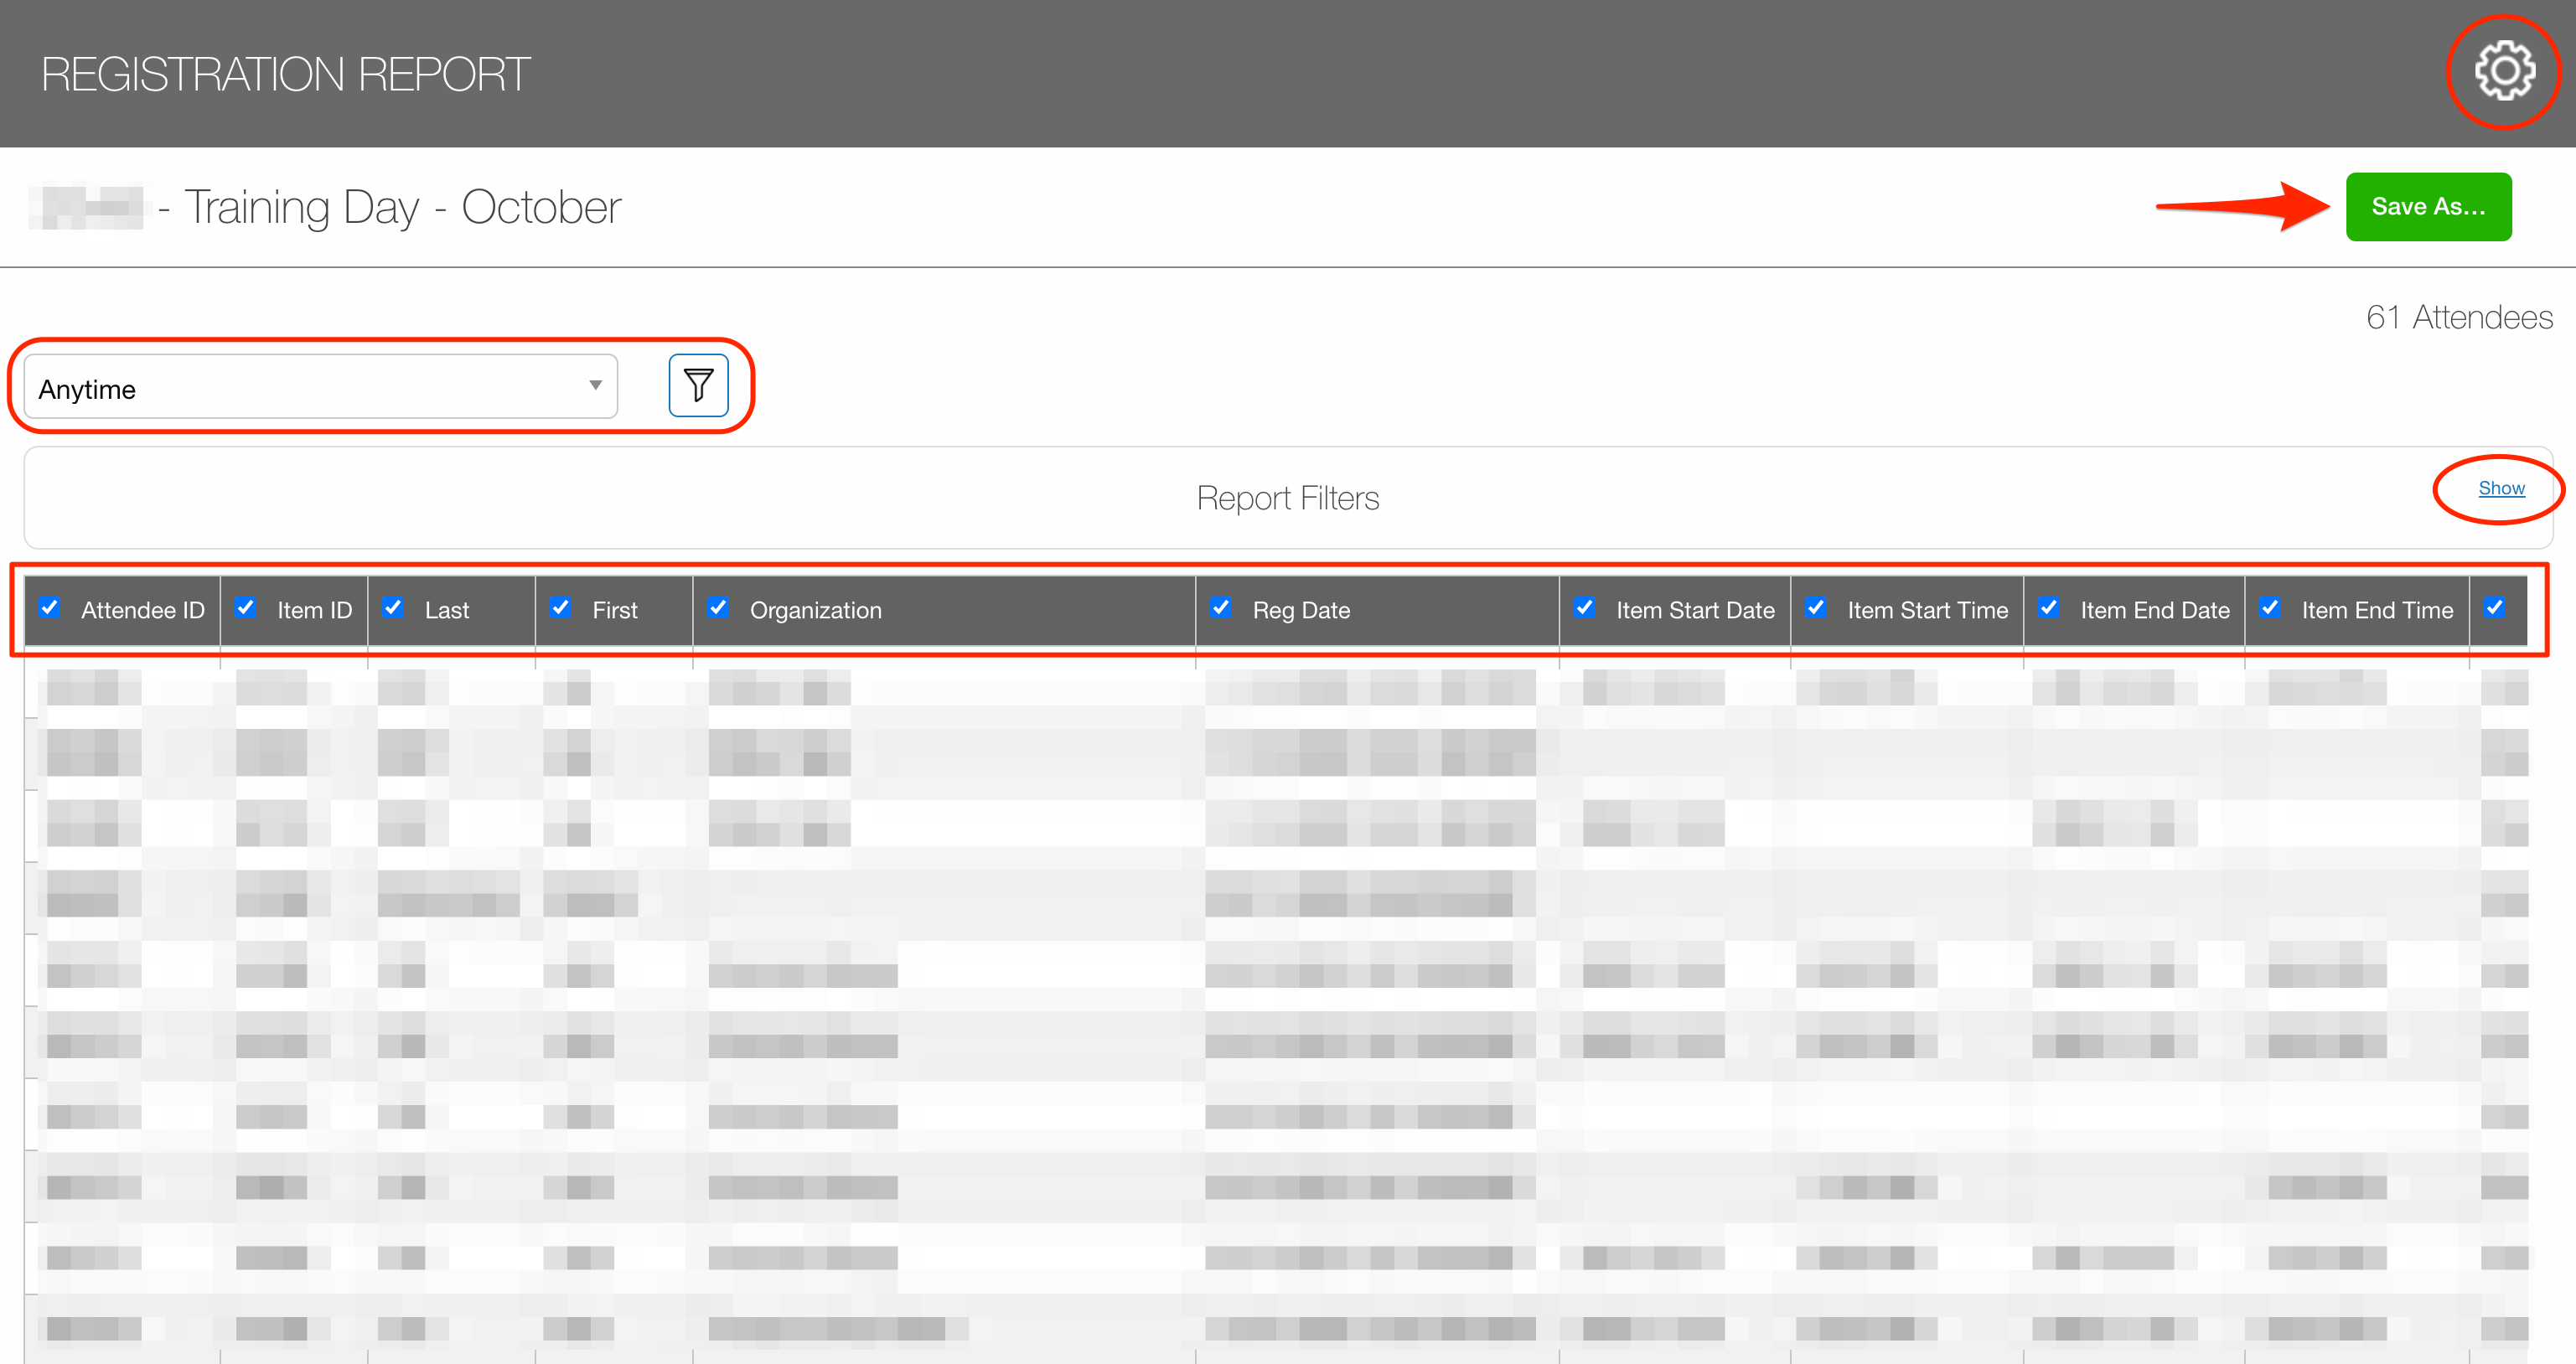
Below is an example snapshot of one of the standard reports offered in Eventsquid. Although each standard report is different, they share a common set of features/elements.
Continue reading to learn about the common functions amongst each of the standard reports.
1) ACCESS
Any of these reports can be accessed from the Event Dashboard. First, click the reporting icon on the left side of your event:
![]()
Then, select your desired report from the menu on the left. When clicked, a short menu will unfold with a list of previously saved templates/versions of this particular report. From this menu, you can:
- click any one of them to open the template (NOTE: you can only see templates that either you created or templates created by a colleague that allow sharing);
- click the X icon to delete a template (NOTE: you can only delete templates that YOU created);
- or, click the ADD NEW VERSION button to start with a fresh template
2) VIEW
Each report is configured and ready to view by selecting the default version of that particular report. Once inside that report, you can choose to apply modifications to the fields and filters.
3) FILTERS & FIELDS
The primary functions within the reporting framework allow you to modify the data fields included in the data output and add filters to the dataset.
The dropdown in the upper left allows you to set a custom date range to view the data. The filter button (next to the dropdown) allows you to filter the dataset.
Each field (column) in the report can be included or excluded, allowing you to hone in on the specific fields you need to look at.
After downloading the report, you will be able to view the applied filters, date range and fields in the export.
4) SHARE & COLLABORATE
When saving a new version of a given standard report, you have the option to make the report shared or private. A shared report is VIEWABLE and DOWNLOADABLE by other admin users within your organization dashboard (NOTE: they must have permissions to access reports). Other users cannot delete reports built by you.
The standard reports can also be sent to parties that are not members of your Eventsquid dashboard, making it easy to collaborate with all stakeholders within your organization.
5) CUSTOMIZE & SAVE VERSIONS
Within the report editor, there is a SAVE button. You can save new templates and overwrite existing templates.
When creating a new version, you will be able to select the timeframe, filter and columns to display on the report. You can edit your version and save it as another; you can also pull up a different version to use as your starting template.